Thermal Imaging for Electrical Distribution Monitoring What can be detected?
• (3 phase) Power distribution • Fuse boxes • Cables & connections • Relays/Switches • Insulators
• Capacitors • Substations • Circuit breakers • Controllers • Transformers • Battery banks
Typical reasons for Thermal Exceptions.
-
Unbalanced loads
-
Harmonics (3rd harmonic current in Neutral)
-
Overloaded systems/excessive current
-
Loose or corroded connections increased resistance in the circuit (typically one side of components heats up)
-
Insulation failure
-
Component failure
-
Wiring mistakes
-
Underspecified components (like fuses) would heat up on both side of the fuse
Abnormal heating associated with high resistance or excessive current flow is the main cause of many problems in electrical systems. Infrared thermography allows us to see these invisible thermal signatures of impending damage before the damage occurs. When current flows through an electric circuit, part of the electrical energy is converted into heat energy. This is normal. But, if there is an abnormally high resistance in the circuit or abnormally high current flow, abnormally high heat is generated which is wasteful, potentially damaging and not normal.
Ohm’s law (P=I*R) describes the relationship between current, electrical resistance, and the power or heat energy generated. We use high electrical resistance for positive results like heat in a toaster or light in a light bulb. However sometimes unwanted heat is generated that result in costly damage. Under-sized conductors, loose connections or excessive current flow may cause abnormally high unwanted heating that result in dangerously hot electrical circuits. Components can literally become hot enough to melt.
Infrared Solutions cameras enable us to see the heat signatures associated with high electrical resistance long before the circuit becomes hot enough to cause an outage or explosion. Be aware of two basic thermal patterns associated with electrical failure: 1) a high resistance caused by poor surface contact and 2) an over loaded circuit or multi-phase imbalance problem.
Contact Problems
Heat is produced by current flow through a contact with high electrical resistance. This type of problem is typically associated with switch contacts and connectors. The actual point of heating may often be very small, less than a 1mm when it begins. Below are several examples found with the IR SnapShot during customer demonstrations.
Thermogram A) is a motor controller for an elevator in a large hotel. One of the three phase connections was loose, causing increased resistance at the connector. The excess heating produced an apparent temperature rise of 50 degrees C (90F). Thermogram B) is a 3-phase fuse installation where one end of one fuse has poor electrical contact with the circuit. The increased contact resistance caused a 45C (81F) hotter apparent temperature at that connection than at the other fuse connections. Thermogram C) is a fuse clip where one contact is 55C (99F) hotter than the others. And thermogram D) is a two-phase wall plug-in where the wire connections were loose causing the terminals to heat 55C (100F) hotter than the ambient. – All temperatures are apparent due to Emmittance, Reflectance and Transmittance

A) Controller

B) 3 Phase Fuse

C) Fuse Clip

D) Wall Plug
All four of these examples were serious and needed immediate attention. Thermogram B) shows an interesting principal used in interpreting thermal patterns of electrical circuit. The fuse is hot at one end only. If the fuse were hot at both ends, the problem would be interpreted differently. An overloaded circuit, phase imbalance, or an undersized fuse would cause both ends of the fuse to overheat. Being hot at one end only suggests that the problem is high contact resistance at the heated end.
The wall plug in Thermogram D) was seriously damaged as seen in the visual picture below, however, it continued to operate until it was replaced.

Overloaded Circuit Problems.
The following thermograms show overloaded circuits. Thermogram E) shows a circuit panel in which the main breaker at the top is over heated 75C (135F) above ambient. This total panel is overloaded and in need of immediate attention. Thermograms E) and F) show all the standard circuit breakers over heated. Their temperatures were 60C (108F) above ambient. Although in the thermogram the wires are blue in color they are also hot, 45 to 50C (81 to 90F). This entire electrical system needs to be redone.

E) Circuit Panel

F) Circuit Panel

G) Controller

H) Current Transformer
Thermogram G) shows one line of a controller that is about 20C (36F) above the others. This needs further investigation to determine why one wire is that much hotter than the others are and to determine the repair needed. Thermogram H) shows a current transformer that is 14C (25F) warmer than the other two transformers in a 3-phase service installation. This indicates a serious imbalance of the service or a faulty current transformer that could seriously impact the customer’s utility bill.
Load Requirements.
When making an inspection it is important that the system is under load. Wait with the inspection for “worst case” or peak loads, or when the load is at least 40% (according to NFPA 70B). Heat generated by a loose connection rises as the square of the load; the higher the load, the easier it is to find problems.
Don’t forget to consider the cooling effect of wind or other air movement
Surface Temperatures Only.
Infrared cameras cannot see through electrical cabinets or solid metal bus trays. Whenever possible open enclosures so the camera can directly see the electrical circuits and components. If you find an abnormally high temperature on the outside surface of an enclosure, rest assured that the temperature is even higher, and usually much higher, inside the enclosure.
Electric Distribution.
Literally hundreds of different pieces of equipment may be found in an electrical system. They start with the utility electricity production, high voltage distribution, switchyards and substations, and end with service transformers, switchgear, breakers, meters, local distribution, and appliance panels. Nearly every type of industry has bought Infrared Solutions cameras to help with maintenance on their end of the electrical distribution system.
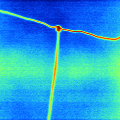
Thermogram M) is a service transformer that had leaked some cooling oil, resulting in dangerously over heated coils near the top. One connection was 160C (288F) above ambient. This transformer needed immediate replacement but the company wanted to delay the repair one month so it could be done during a scheduled total plant shutdown. They used the IR SnapShot camera to monitor the state of the transformer and successfully delayed the repair. Thermogram N) is for a pole mounted service transformer that has a connection 30C (54F) hotter than ambient. Such a condition required maintenance at the next convenient opportunity. Thermogram O) shows a hot main connection on an interrupter at a substation in Mexico. The connection was found to be 14C (25F) hotter than the others. This was believed to be a problem that needed attention. Thermogram P) shows an overhead connection in a Peru substation. It was less than 10C or (18F) above ambient and not of immediate concern. – All temperatures are apparent due to Emmittance, Reflectance and Transmittance

M) Transformer